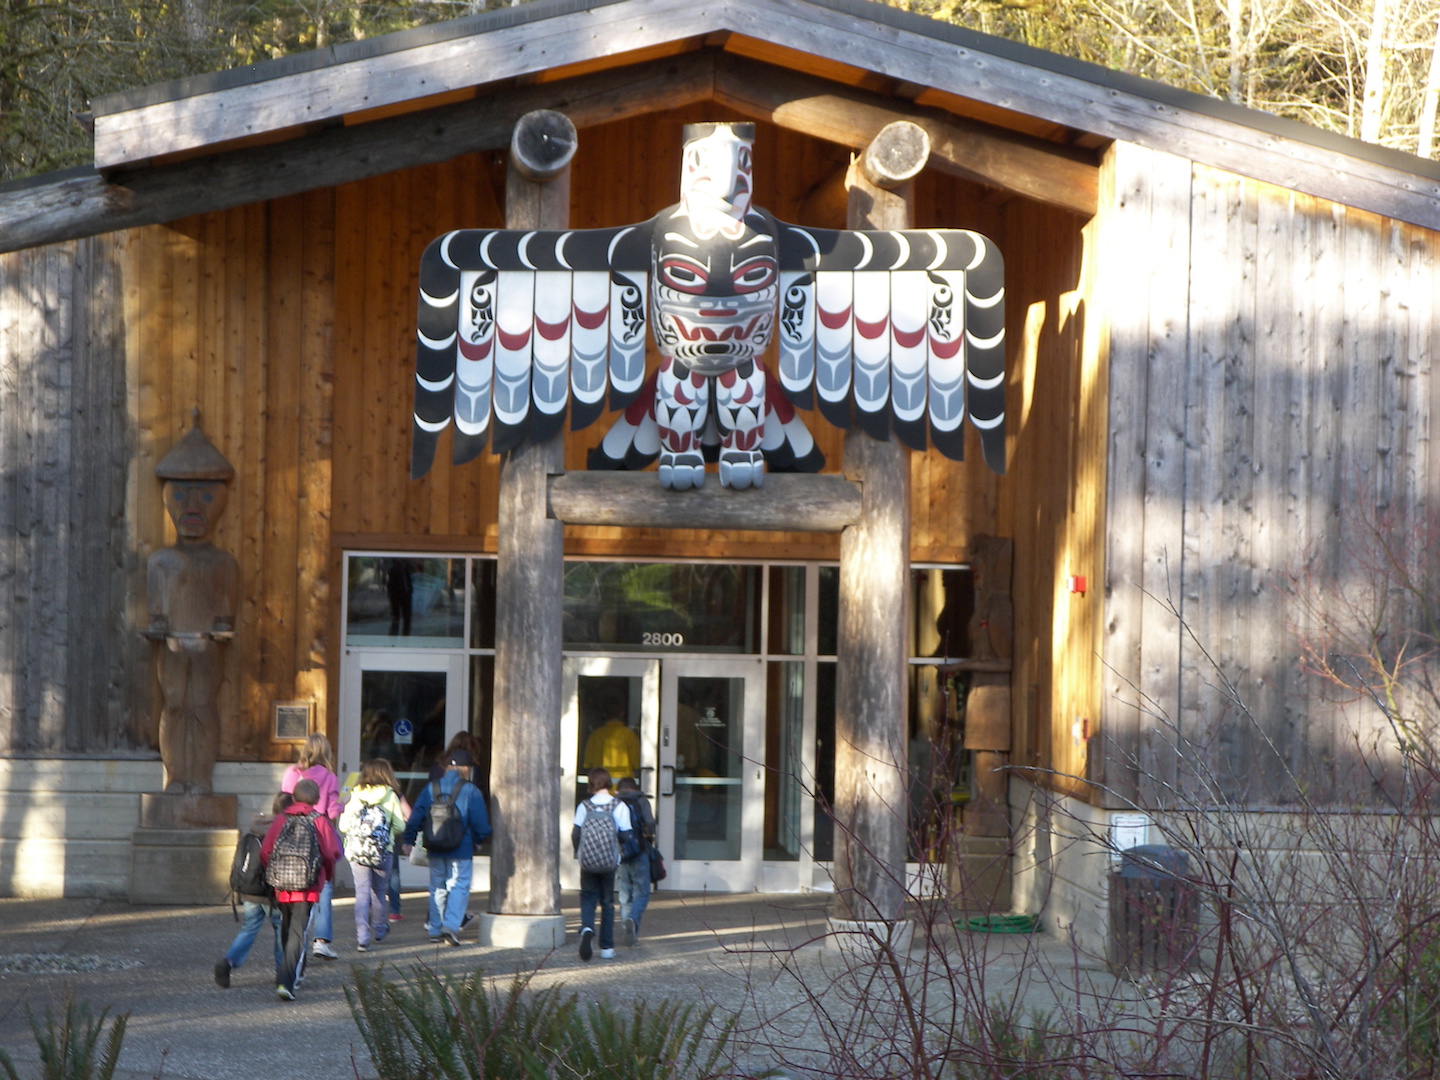
Big news from the NREP. You’ve likely seen many posts over the years about the twice-yearly water quality testing done across the Nisqually Watershed. These testing events bring out hundreds of students from 4th-8th grade out to testing sites to test water samples for things like: Dissolved Oxygen, Temperature, pH, Nitrates, Fecal Coliform, Total Suspended Solids, Turbidity, and Biochemical Oxygen Demand. All of these parameters can help identify good or poor water quality. These students are then invited to represent their classes at the annual Student GREEN Congress, where they share their results and discuss issues of water quality in the watershed.
The NREP has been collecting this water quality data since 1996 across over 60 sites and it has now officially been compiled and organized into graphs for each site. With the help of the Nisqually Indian Tribe’s GIS department, we present to you our water quality data map.